|
| Enero 2019. |


 |
| Ultima fase de encementado 25 octubre 2018 |


Blog sobre Redecilla del Camino y comarca.
|
| Enero 2019. |
|
| Ultima fase de encementado 25 octubre 2018 |
| Evolucion de la poblacion desde 1900 hasta 2018 | |||
| Año | Hombres | Mujeres | Total |
| 2018 | 72 | 43 | 115 |
| 2017 | 70 | 42 | 112 |
| 2016 | 74 | 47 | 121 |
| 2015 | 81 | 55 | 136 |
| 2014 | 71 | 54 | 125 |
| 2013 | 65 | 50 | 115 |
| 2012 | 69 | 58 | 127 |
| 2011 | 76 | 61 | 137 |
| 2010 | 73 | 54 | 127 |
| 2009 | 76 | 57 | 133 |
| 2008 | 77 | 56 | 133 |
| 2007 | 83 | 56 | 139 |
| 2006 | 79 | 61 | 140 |
| 2005 | 80 | 66 | 146 |
| 2004 | 80 | 68 | 148 |
| 2003 | 88 | 68 | 156 |
| 2002 | 88 | 64 | 152 |
| 2001 | 88 | 60 | 148 |
| 2000 | 87 | 63 | 150 |
| 1999 | 88 | 56 | 144 |
| 1998 | 88 | 62 | 150 |
| 1996 | 92 | 64 | 156 |
| 1995 | 91 | 63 | 154 |
| 1994 | 94 | 66 | 160 |
| 1993 | 88 | 60 | 148 |
| 1992 | 86 | 57 | 143 |
| 1991 | 87 | 60 | 147 |
| 1990 | 87 | 62 | 149 |
| 1989 | 85 | 66 | 151 |
| 1988 | 89 | 67 | 156 |
| 1987 | 89 | 67 | 156 |
| 1986 | 89 | 67 | 156 |
| 1981 | 0 | 0 | 163 |
| 1970 | 0 | 0 | 249 |
| 1960 | 0 | 0 | 305 |
| 1950 | 0 | 0 | 346 |
| 1940 | 0 | 0 | 354 |
| 1930 | 0 | 0 | 381 |
| 1920 | 0 | 0 | 379 |
| 1910 | 0 | 0 | 379 |
| 1900 | 0 | 0 | 335 |
| Poblacion Estacional Máxima | |||
| Año | Personas | ||
| 2016 | 300 | ||
| 2015 | 300 | ||
| 2014 | 300 | ||
| 2013 | 300 | ||
| 2012 | 300 | ||
| 2011 | 193 | ||
| 2010 | 193 | ||
| 2008 | 202 | ||
| 2005 | 200 | ||
| 2000 | 400 | ||


| Habitantes segun Pais de Nacimiento | |||
| Pais | 2017 | Dif (2016) | |
| Marruecos | 1 | 0 | |
| Brasil | 2 | -1 | |
| Paraguay | 1 | 0 | |

| Top Municipal % Habitantes nacidos en otro pais | |||
| Provincia | Municipio | Pos | % |
| Burgos | Viloria de Rioja | 840 | 15,56 |
| Valladolid | Palazuelo de Vedija | 2.745 | 8,29 |
| Burgos | Castildelgado | 4.509 | 5,00 |
| La Rioja | Grañón | 4.705 | 4,71 |
| Zamora | Valdescorriel | 5.485 | 3,57 |
| Burgos | Redecilla del Camino | 5.486 | 3,57 |
| Zamora | Villaferrueña | 5.487 | 3,57 |
| La Rioja | Villarta-Quintana | 7.503 | 0,69 |
| Burgos | Bascuñana | 7.669 | 0,00 |
| Burgos | Ibrillos | 7.689 | 0,00 |
*.- Población de Redecilla del Camino por sexo y edad 2017 (grupos quinquenales) | |||
| Edad | Hombres | Mujeres | Total |
| 0-5 | 0 | 1 | 1 |
| 5-10 | 1 | 1 | 2 |
| 10-15 | 1 | 1 | 2 |
| 15-20 | 2 | 0 | 2 |
| 20-25 | 2 | 4 | 6 |
| 25-30 | 3 | 2 | 5 |
| 30-35 | 2 | 1 | 3 |
| 35-40 | 3 | 1 | 4 |
| 40-45 | 4 | 5 | 9 |
| 45-50 | 7 | 3 | 10 |
| 50-55 | 7 | 5 | 12 |
| 55-60 | 10 | 4 | 14 |
| 60-65 | 7 | 2 | 9 |
| 65-70 | 6 | 1 | 7 |
| 70-75 | 7 | 3 | 10 |
| 75-80 | 3 | 2 | 5 |
| 80-85 | 3 | 1 | 4 |
| 85- | 2 | 5 | 7 |
| Total | 70 | 42 | 112 |
| Diciembre 2018 | Total Afiliados | Variación | |||
| Mensual | Anual | ||||
Absoluta
| Relativa | Absoluta | Relativa | ||
Total
| 17 | +1 | 6.25 % | +2 | 13.33 % |
REGIMEN:
| |||||
GENERAL
| 4 | 0 | 0 % | -1 | -20.00 % |
AUTONOMOS
| 9 | 0 | 0 % | +2 | 28.57 % |
AGRARIO
| 4 | +1 | 33.33 % | +1 | 33.33 % |
HOGAR
| 0 | 0 | 0 % | 0 | 0 % |
MAR
| 0 | 0 | 0 % | 0 | 0 % |
CARBON
| 0 | 0 | 0 % | 0 | 0 % |


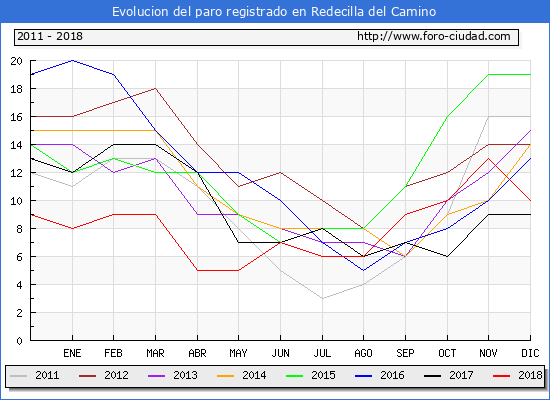
| Diciembre 2018 | Total Parados | Variacion | |||
| Mensual | Anual | ||||
Absoluta
| Relativa | Absoluta | Relativa | ||
Total
| 10 | -3 | -23.08 % | +1 | 11.11 % |
HOMBRES
| 4 | -1 | -20.00 % | 0 | 0 % |
MUJERES
| 6 | -2 | -25.00 % | +1 | 20.00 % |
MENORES DE 25 AÑOS:
| 0 | 0 | 0 % | 0 | 0 % |
HOMBRES
| 0 | 0 | 0 % | 0 | 0 % |
MUJERES
| 0 | 0 | 0 % | 0 | 0 % |
ENTRE 25 Y 44 AÑOS
| 5 | -2 | -28.57 % | +2 | 66.67 % |
HOMBRES
| 1 | -1 | -50.00 % | +1 | 100.00 % |
MUJERES
| 4 | -1 | -20.00 % | +1 | 33.33 % |
MAYORES DE 45 AÑOS
| 5 | -1 | -16.67 % | -1 | -16.67 % |
HOMBRES
| 3 | 0 | 0 % | -1 | -25.00 % |
MUJERES
| 2 | -1 | -33.33 % | 0 | 0 % |
SECTOR:
| |||||
AGRICULTURA
| 1 | -1 | -50.00 % | -1 | -50.00 % |
INDUSTRIA
| 0 | -1 | -100.00 % | 0 | 0 % |
CONSTRUCCIÓN
| 1 | 0 | 0 % | 0 | 0 % |
SERVICIOS
| 8 | -1 | -11.11 % | +2 | 33.33 % |
SIN EMPLEO ANTERIOR
| 0 | 0 | 0 % | 0 | 0 % |


“Los pueblos siempre fueron los mejores cortafuegos, pero sus montes se han convertido en justo lo contrario, en un auténtico polvorín”. ...


.JPG)